|
I have created budgets for a lot of SaaS and non-SaaS startups and am sharing the budget template. If the company is mature enough you will need to use a system like Adaptive or Hyperion. However, the below google template can be used as a good starting point to create your budget for most of the startups. Please feel free to copy, modify and use.
Link to the Master SaaS budgeting spreadsheet
0 Comments
In wandering around the Internet as I follow interesting companies, I noticed some action with AppDynamics. AppDynamics is an intelligent application performance monitoring company. Check more here. Their total funding as of date is 350M+. More details here. They just filed an S-1 on December 28th, 2016. See here.
The company highlights are as follows:
This Raises Some Questions and Thoughts The cash flow from operations (CFO) for the 9 months ending Oct 31 2016 was only negative 2.2M USD. Can that be improved? CFO in the last quarter of 2016( Oct 31 2015 - Jan 31 2016) was 7M+. Is the company approaching positive cash flows? How much of the current $12B TAM can AppDynamics capture? There is already plenty of competition including New Relic, which went public a couple of years back. They aren’t profitable either. The Sales & Marketing (S&M) spend seems high. S&M spend is $118M for 9 months ending Oct 31st 2016 while Revenue increased only 56M during the period over the corresponding 9 months in 2015. Is this just “landing” in the “land and expand” strategy? The S-1 takes this concern head on by stating: “ Investments we make in our sales capacity will occur in advance of any return on such investments, making it difficult for us to determine if we are efficiently allocating our resources in these areas”. New Relic ended the first half of the year with 122M in revenue whereas AppDynamics finished the last 9 months with 158M in revenue. New Relic as of Jan 6th had 1.6B in market cap and had been as high as 2B a few months back. What should AppDynamics valuation be? It last raised capital at 1.9B valuation. To sum it up, this will be a closely watched IPO in the tech industry, especially after a lackluster 2016. Anything that can be measured is a metric. KPI’s or Key performance indicators, are a subset of metrics and are, as the name suggests, key indicators of performance.KPI's should be religiously and objectively tracked. One should put a quarterly, yearly and multi-year target on the KPIs.
Each department or sub-departments can have their own KPI’s. However, at the executive level there should be a maximum of 5 KPI’s. Departmental KPI’s should be understood in the context of the executive KPIs. Executive KPI’s should be tightly aligned with company’s goals and strategy. KPI’s should be easily understood across the company so everyone is aware of the progress and the effort needed to get to the promised land and beyond. KPIs should be used in the forecast process so we can keep a close tab. KPI’s can also be used a compensation tool so the incentives are properly aligned. What is a cap table ?
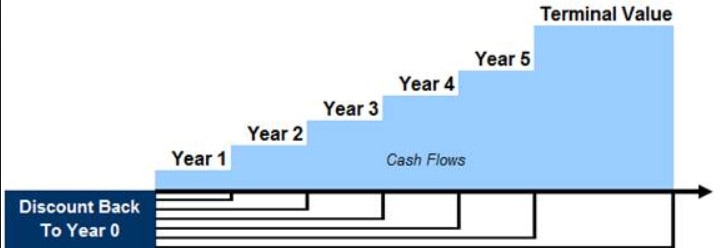
Simply put, a cap table is a point in time ownership report. A cap table captures all transactions / option and warrant grants since the beginning of the company. A company’s capital structure (excluding debt) usually consists of preferred shares, common shares, warrants and options. Preferred shares are reserved for investors. Depending on the number of rounds Preferred shares are divided into different classes Preferred A, Preferred B, Preferred C and so on. Warrants are usually given to investors (mostly debt) to be converted into one of the Preferred share classes. Common Shares are also divided into classes let's just call it Common A and Common B, one of which is reserved for founders. The other class of Common Shares are for option conversion. Options are common stock options granted to employees (ISO’s) and consultants(NSO’s). If the value of options granted to an employee is greater than a $100K, then those options will be classified as NSO’s. The company’s outside counsel is usually responsible for managing the cap table. Software such as Solium or eShares is used. What is the use of cap table ? The most common use is it gives you the ownership details. However, there are plenty of other uses Fund Raising Most investors ask for Cap table along with an investor deck. This gives investors an idea of the capital structure and how they can fit in. On the other hand, it gives the founders an idea of how the capital structure will look if they raise a certain amount. Franchise Taxes Most companies register themselves in Delaware to save on corporate taxes. Companies, however, have to pay franchise taxes in Delaware. These taxes are calculated based on authorized shares. See here 409(a) valuation Companies issue stock options to its employees at board meeting every quarter. The stock options are valued by a valuation firm in a 409(a) report.(see my previous post on Option valuation). Companies are required to do a 409(a) valuation every year. Stock compensation Stock options are compensation similar to salary. Per US GAAP (ASC 718, previously FAS 123R), the company is required to record stock compensation in the financials. This requires an up to-date cap table. Softwares such as Solium or eShares can calculate it for you. Warrants are also compensation or contra-debt and need to be valued every year. IRS filings (Form 3921) Companies are required to report all stock option exercises with the IRS(Form 3921). See here . Softwares such as Solium or eShares can file it for you electronically. All you need to get TCC from IRS.  What is a 409(a) valuation ? For a private company, 409(a) valuation decides the value of stock options to be granted to your employees. Usually a DCF or backsolve valuation or a combination is done to get to the option price. I created a model to calculate option pricing using backsolve method. Please feel free to use it to validate your 409(a) valuation. With my compliments, you can follow my slideshow guide to create DCF valuation. Download Option Valuation Sheet Sometime back I trained a few academic folks on DCF valuation. Here is the presentation and an excel file with how to use DCF to calculate company value.
DCF Presentation Download DCF Valuation Sheet |


 RSS Feed